For almost every office-based job, you’re going to need to know how to use Excel (or the google equivalent – ‘sheets’). If you work in Finance or Accounting like me, chances are you’ll be using it around the clock. So when it comes to interviewing for jobs, it’s crucial you demonstrate you have this skill.
For most jobs, it is worth including a line demonstrating your Microsoft Excel skills on your CV or resume. Many jobs across countless industries rely heavily on Excel. A single line describing yourself as proficient with Excel and showing a few formulas you’re comfortable with should be sufficient.
To demonstrate proficiency in Excel on your CV, it is crucial you can demonstrate at least some of the below:
- Basic functionality – changing the contents of cells and manipulating formats
- How to filter and sort data
- Understanding of basic, intermediate and advanced formulae
- How to delete, copy and move tabs
- How to use paste special, conditional formatting, borders and pivot tables
- How to use VBA.
The good news is, even if you’re a complete novice with Excel, you can become proficient in the basics very quickly (for free) using the multitude of great resources online. Once you have mastered the below 10 steps, you can confidently put ‘proficient with Excel’ on your CV with a host of great examples should you be asked about it within an interview. So let’s start simple and work our way up to Excel mastery.
#1 – Basic functionality of excel
Most people will have some experience in Excel, whether it’s from your school days or using it within your day job. The best way to understand the basic functionality of Excel such as adding and deleting rows and columns, adding data to cells or changing font and cell colours, is simply to have a play around. As the Microsoft Excel interface is consistent with Word and Powerpoint, most of these things should be fairly simple to understand and come to terms with.
If you are struggling with this step, I would recommend you find an online course (such as this one I found on Youtube) that walks you through Excel from the very beginning.
Once you’re done with this step, let’s move on to understanding the main ways you can format an excel document to produce a clear, visually appealing spreadsheet.

#2 – Understanding how to format excel
Most of us will be familiar with the feeling of opening a messy, chaotic spreadsheet that is full of data that’s difficult to understand. However, with Excel’s built-in functionality, this shouldn’t be the case. There are a number of important features to learn which can help in making your spreadsheet far more user friendly.
The items that immediately spring to mind include using the fill function to colour a cell which is useful for differentiating between different data. For example, if you made an excel spreadsheet to record the scores in your son’s football league, you could colour all the cells in which his team won the match green to present the data more visually.
Using borders is another important feature to enhance how your spreadsheets look. Many small business owners use excel to produce their financial accounts and this is a great example of where borders can be helpful. Take a look at the image below which show’s what I mean.
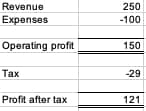
As can be seen to the left, I have used borders to more clearly distinguish the key information and show that these are subtotals. Similarly, I may have chosen to use the ‘bold’ font or ‘underlined’ font for these cells as well to better distinguish the important information.
You can take it a step further and visualise your data in tables and graphs by going to the insert tab and then selecting exactly what you want.
#3 – Get to grips with the basic formula of excel
In many ways, Excel acts like a highly sophisticated calculator once you start to learn how to use the different formulae available. To start with, you want to get comfortable with very simple things like how to add, subtract, multiply and divide within Excel.
The next obvious formula I would start to learn is the SUM formula. Let’s say you had a string of 10 numbers in Column A, in the cell beneath the list if you insert =SUM(A1:A10) it will add this list together for you immediately. Whilst simplistic, this is still one of the most used formulas in my day job as a qualified Accountant.
Similarly =Count(A1:A10) and =Average(A1:A10) will provide you with the number of entries (10) and the average of the 10 numbers should you need this information. Inserting a formula like this can be done in two main ways a) go to the formulas tab along the top of the sheet and select the applicable formula or b) once you become more familiar, you will remember the formula as I have done above and can type it straight in.
If you’re going to highlight your skills in excel on your CV, you really have to know this kind of thing at an absolute minimum to avoid an awkward silence if you get asked about it within an interview.
#4 – Learn how to filter and sort lists of data
This is where understanding Excel can really start to save you some time. Let’s say you had a list of all of your colleagues at work and their response to whether or not they can attend the Christmas party as shown below.
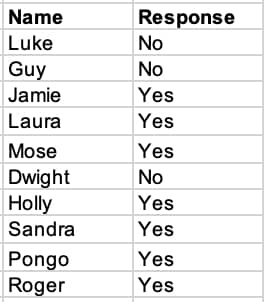
As you can see to the left, we have recorded the responses of our 10 work colleagues on whether they can attend the Christmas party. If we select the top two rows (name and response) and then go to Data -> Filter we can apply a filter to this data as shown in the second image below
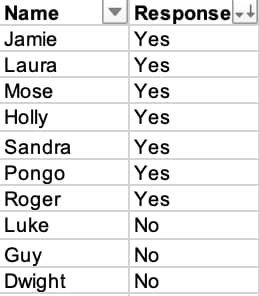
As you can now see, the top two rows of data have drop-down symbols beside them which symbolise that the data has had a filter added to it. If we click on the drop-down beside the ‘response’ heading, we will have the option to ‘sort’ the data. This is helpful as we can now more intuitively see the list of ‘yes’ responses and make the arrangements for these colleagues as needed.
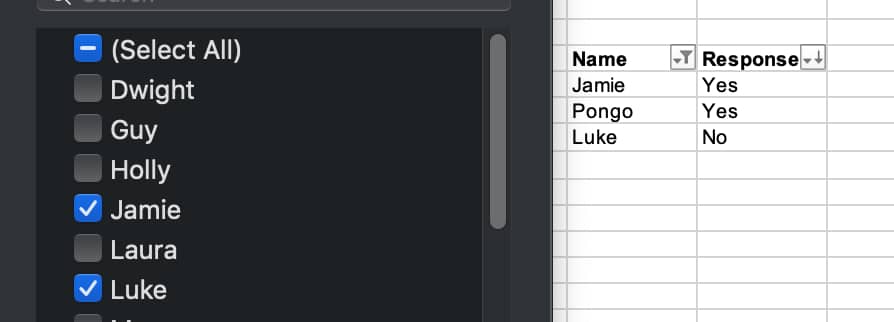
Similarly, if you were to click the dropdown box next to the ‘name’ heading, you could filter the information for specific names. Say you were only interested to know whether a couple of particular people had RSVP’d yes or no, you would filter by their names only as shown.
Once you successfully master how to use the filter option within Excel, you can really begin to take value out of the programme and save yourself a lot of time.
#5 – Recognise the importance of deleting, moving and copying tabs
Within an Excel file, along the bottom, you may have multiple tabs. For example, you may have one tab which is your annual household budget and another tab which is your investment returns within an overall spreadsheet called ‘My personal finance’.
Learning how to add a new tab, delete an unwanted tab and move and copy tabs between different Excel documents is fairly simple and you should be able to pick it by up watching this five-minute video from Youtube.
#6 – Step it up a gear by learning some intermediate formulae
We’ve spoken already about learning basic formulae like =SUM, =COUNT and =Average and whilst these are a good starting point, they will only get you so far. At this stage, it is well worth learning formulas such as:
a) =SUMIF
Similar to the =SUM formula above in that the end result is it adds up the cells but this time, it only takes the cells you specify e.g. add cells up IF they are greater than 100 or add cells up IF the name in the adjacent cell is ‘Luke’.
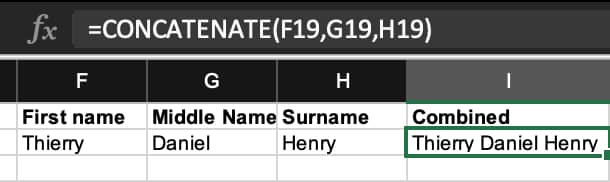
b) =CONCATENATE
This sounds complicated but it’s actually really easy. Let’s say you had 3 columns that showed first name, middle name and surname and you wanted to combine this to show the full name in a single cell, you would simply put =CONCATENATE(cell1, cell2, cell3) to combine them as shown below.
c) =MIN or =MAX
To find the smallest or largest number within a data set, you would use these formulas e.g. =Min(A1:A26) if A1 to A26 was where the list of numbers was stored.
#7 – Learn how to use conditional formatting to make your work more visual
Conditional formatting is a great tool to use to take your spreadsheet to the next level. I use conditional formatting on a lot of my personal spreadsheets to visually show information. For example, if I was tracking which days I went to the gym in the month e.g.
Day 1: Yes Day 2: Yes Day 3: No
I would use conditional formatting so that if I put ‘Yes’, this would automatically highlight green whereas if I put ‘no’ it would automatically highlight the cell red. This saves you the trouble of having to fill the cell colour each time to make your data more visual as you can set the rule at the start and it will automatically update as you enter the information.
#8 – Become a master at pivot tables
Pivot tables are an advanced Excel skill that lets you turn raw data into understandable, clear information easily. Whilst this one may take a little longer to learn, it should still be a fairly straightforward job by following a Youtube guide such as this one.
Pivot tables are a functionality within excel that allows you to summarise, sort, organise and order information within a data set to show information in a more meaningful, helpful format. A huge database of details stored within Excel may have all of the information someone requires, but if they can’t quickly take from that data what they need, it is essentially worthless. If the same data was converted into a pivot table that organised and sorted the data to provide the specific information the user was looking for, this is far more useful.
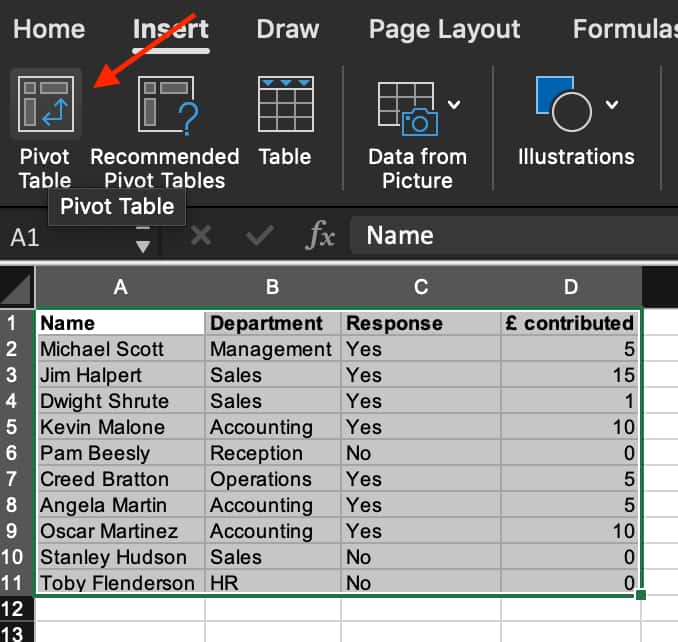
As an example, let’s say you are organising a fun run for charity and you are collecting donations from your work colleagues and recording them within an excel spreadsheet as shown in the image on the left below. To make this information more understandable, you can select all of the data, go to the ‘insert’ tab at the top and click on pivot table.
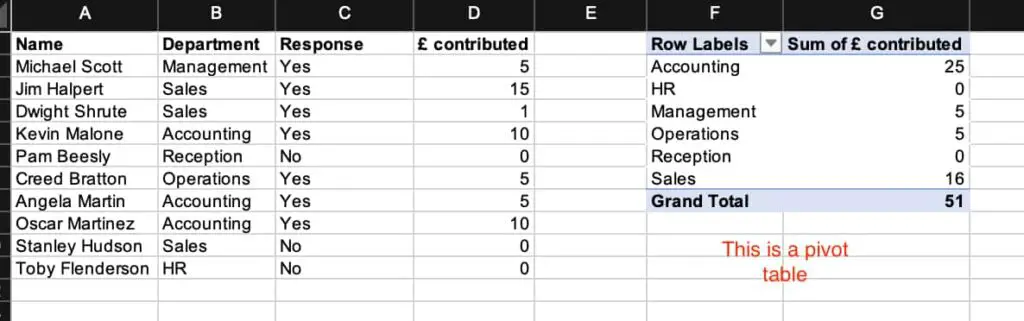
Once you have followed the instructions, you may be left with a table as shown in the second image (I selected department as rows and £ contributed as values). By doing this, I can easily see the total amount contributed so far (£51) and which departments have contributed the most. For example, it is clear the Accounting department have contributed the most (£25) so I may offer a special thanks to that team.
As I’m sure you can imagine, this is a highly simplified example and there are thousands of ways you could use the pivot table functionality to present useful information.
#9 – Get the hang of advanced formulae such as VLOOKUP
As we move onto the more difficult parts of Excel, some users may get overwhelmed at the complexity and be happy using the functionality they are comfortable with. That’s fine but it is worth noting that advanced formulas such as =VLOOKUP can save huge amounts of time in particular tasks.
I used the VLOOKUP formula on a near-daily basis during my time as an auditor and without this formula (or similar alternatives) I would have been forced to manually trawl through huge volumes of information which is time-consuming and boring.
So what does it do? The =VLOOKUP formula is a function that makes Excel search for a certain value in a column, in order to return a value from a different column in the same row. Sound confusing? Let’s look at an example below.
Let’s say you had a list of thousands of product codes with their prices listed next to them but you only want to find the price for two of these products. Have a look at the example below, for product ‘ABCDE5’ – the formula has correctly picked up the price from the list of £6.04
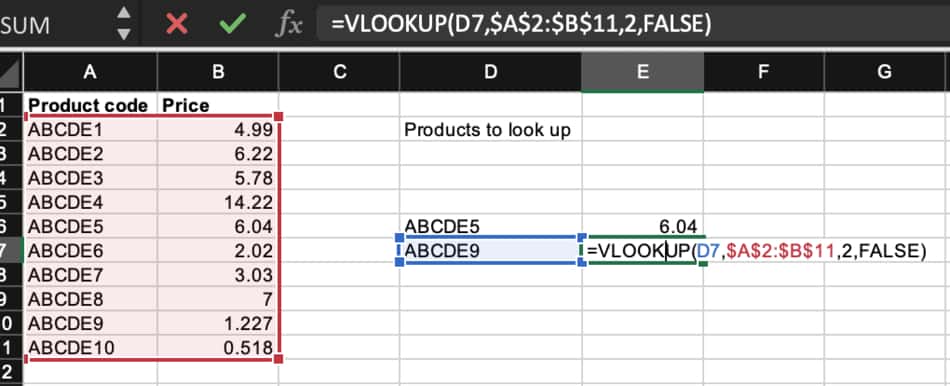
So let’s take a look at what this formula actually means – =VLOOKUP(D7, A2:B11,2, false)
This can broadly be thought of as =VLOOKUP(What you want to look up (product number), where you want to look for it (price list), the column number in the range containing the value to return (column 2 contains the prices), return an Approximate or Exact match – indicated as TRUE or FALSE (we chose false as we want an exact match).
You may notice in the example above in the formula I have $ symbols around the ‘Where you want to look for it’ section. This is Excel’s way of allowing me to lock the cell references which means when I look for the product code, it only looks within the cells I’ve specified, even when I drag the formula down to lookup other products’ prices.
Again, this formula will take some getting used to and will require some practice. I would advise finding a video on Youtube to explain this and then practice with some data of your own until it becomes second nature. Once you are confidently using formulas like this at the appropriate time, you can confidently put on your CV that you are highly proficient at Microsoft Excel and will feel comfortable with the vast majority of the Excel functionality most people use on a daily basis.
#10 – Geek out and learn Excel’s source code – VBA
If you want to take it a step further, you can consider learning VBA. VBA stands for Visual Basic for Applications and is essentially Microsoft’s programming language. You may have heard this referred to as ‘using macros’ but in truth, VBA is more than just this and underpins all of the formula and functionality we have discussed throughout the rest of this post.
Unlike the other 9 steps, this can’t be effectively learnt by a single Youtube video and some practice. Much like learning another coding language, to become an effective user of VBA, you will likely have to shell out on a book (such as this one offered at Amazon) and practice over a number of months. Whilst this may sound like a huge commitment – once you master VBA, you unlock a whole new world of usability within Microsoft Excel and can begin to do things the standard functionality simply doesn’t offer.
Having said that, for the majority of users, this step isn’t strictly necessary and you can get by just fine whilst still being highly proficient in Excel without learning VBA – the choice is yours.
Conclusion
Learning the above 10 steps will take beginners a bit of time but if you stick with it and make the most of the great online resources for learning Excel, you will become competent sooner than you may think. Most employers, particularly in the finance industry, view Excel as a non-negotiable skill prospective employees must-have. It’s therefore hugely important that you master the above skills and tick the box on your CV and with future employers that says you understand and have experience with using Excel.
This article has been written by Luke Girling, ACA – a qualified Accountant and personal finance enthusiast in the UK. Please visit my ‘About‘ page for more information. To get in touch with questions or ideas for future posts, please comment below or contact me here.